Mapping Haggadah printed editions (and being careful about it)
Why is this digital Haggadah special? – The DiJeSt Ground Truth Haggadah

A spot-the-difference puzzle for passover, or: help us identify the Jalfon Haggadah!
Meet DiJeSt – DIgitizing JEwish STudies
"Ma Nishtana"(what has changed?), traditionally sung by the youngest child at the beginning of the Passover Seder. In Hebrew from the Sarajevo Haggadah, a famous illuminated manuscript from circa 1350 ce.. Image taken from Wikimedia commons, (last visited April 3, 2020).
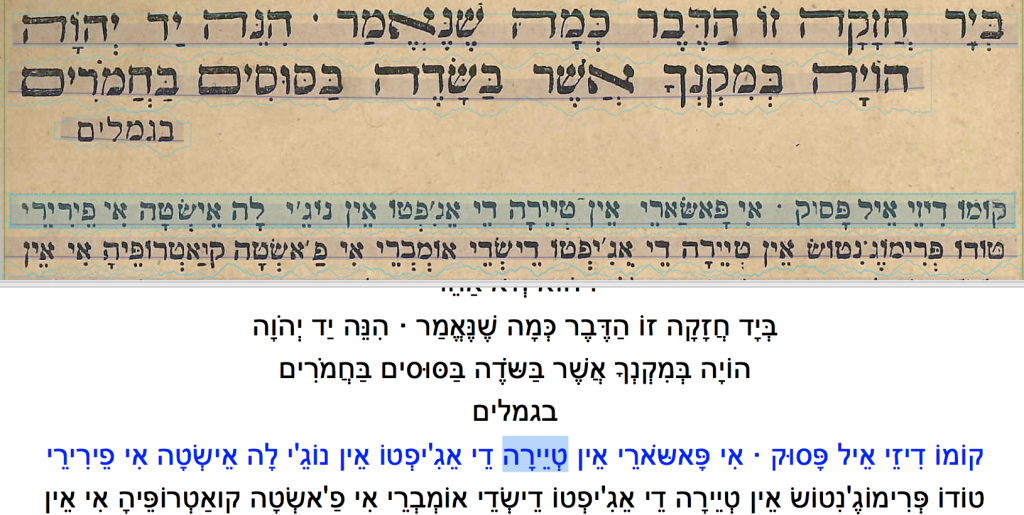
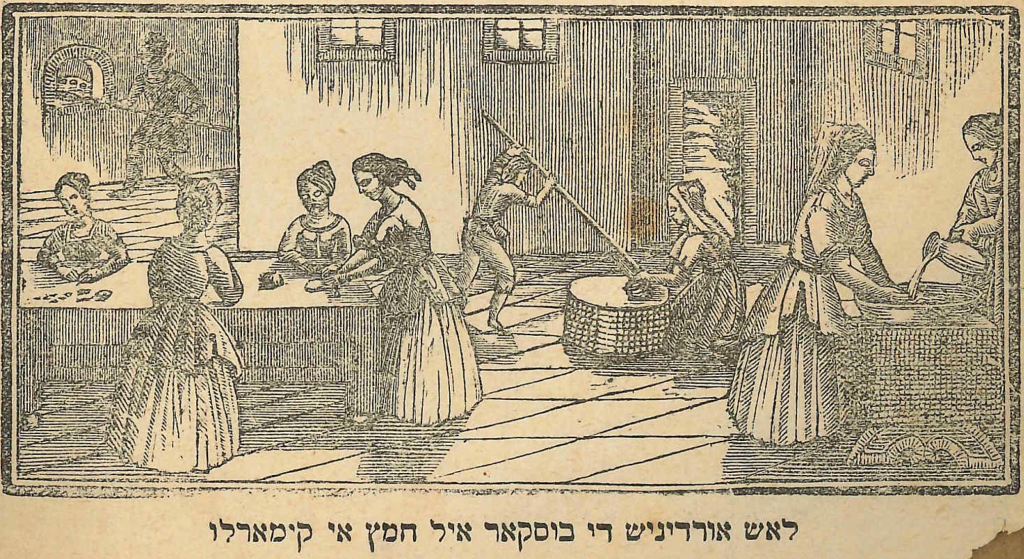
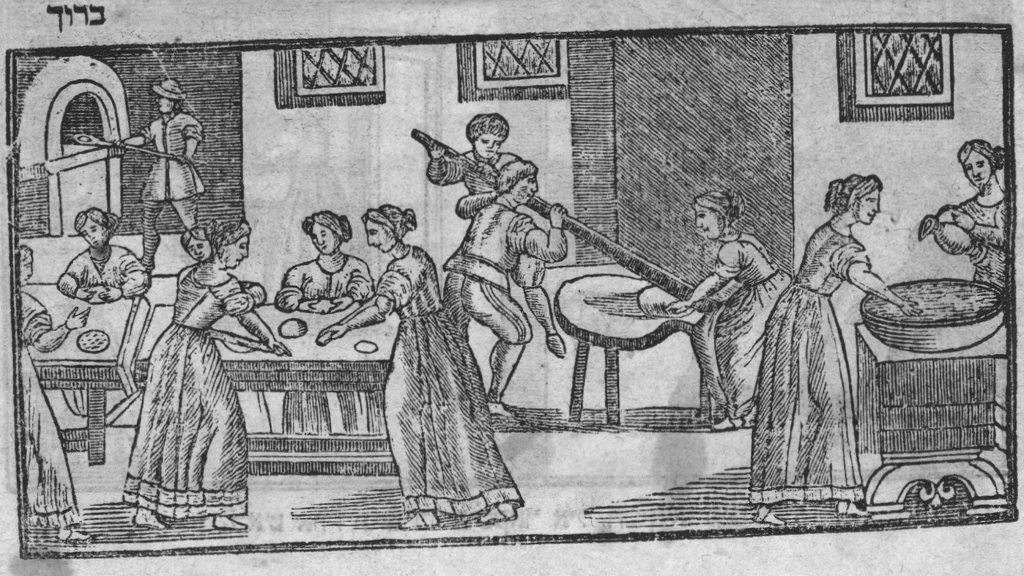
It is even more appropriate to start by sharing as the first digital fruit of our project a family haggadah. This specific 19th century Hebrew-Ladino Haggadah, bearing the stamp of Abraham J. Jalfon (1875-1949) from Tetouan, Morocco, arrived via Spain to Israel with Michel Jalfon, his great grandson, who is one of the contributors to this project.
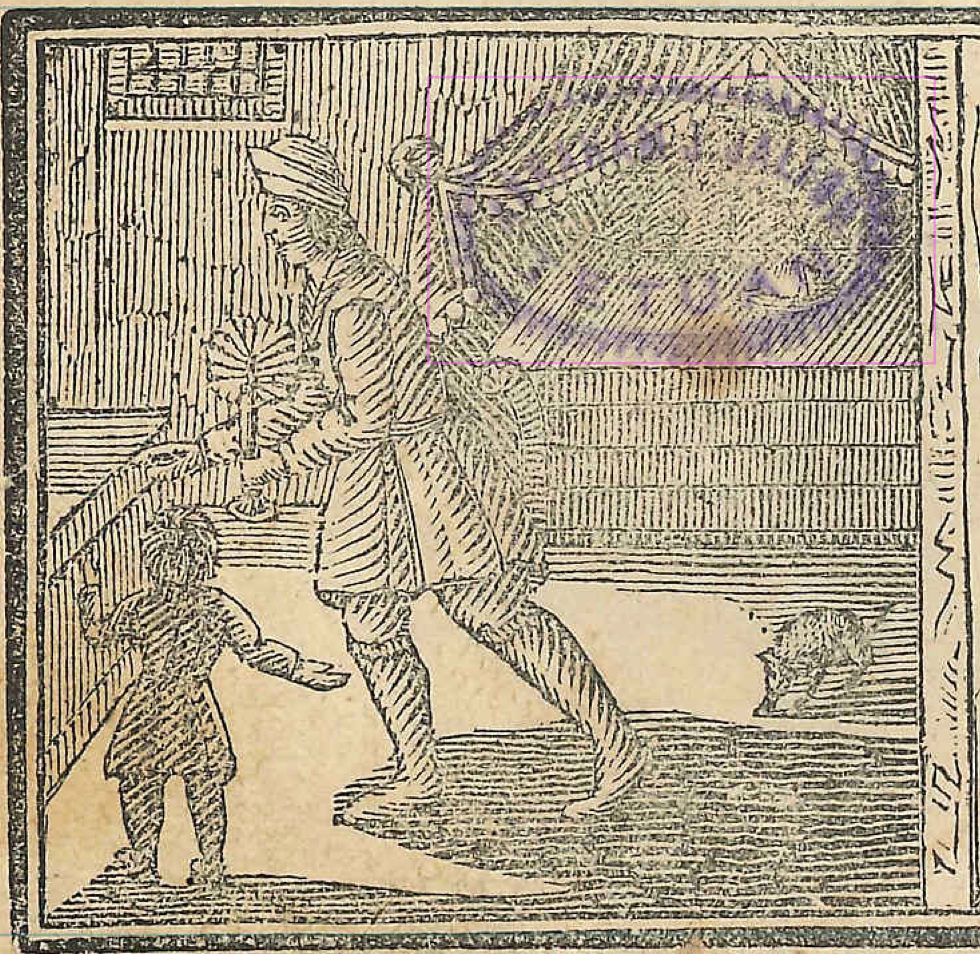
Abraham J. Jalfon’s stamp